

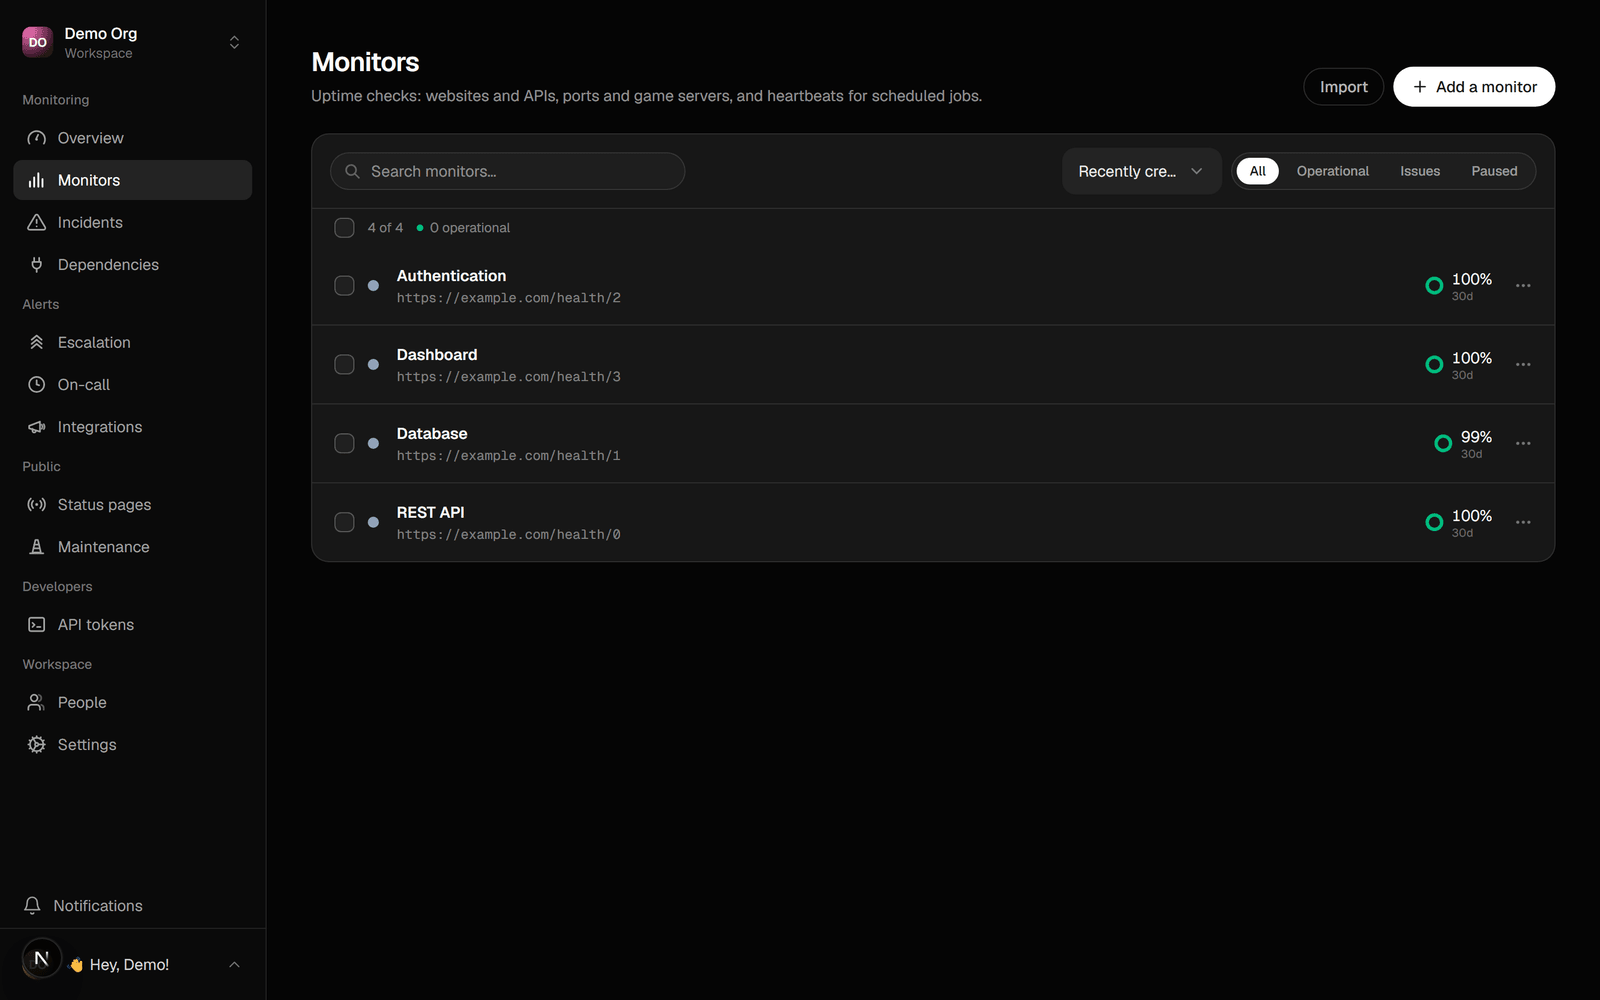
Monitor types
- HTTP. Request a URL and assert on the response: expected status codes, a keyword that must be present or absent, a response-time budget.
- Heartbeat. For cron jobs and workers. Your job pings a URL on a schedule; a ping that’s late by more than the grace period is a miss.
- TCP. Open a connection to a host and port (databases, mail, game servers).
- DNS. Resolve a record and assert on the answer, optionally through a specific nameserver.
- SSL. Watch a certificate’s expiry and warn before it lapses. This sends an internal ops alert, not a public incident: a soon-to-expire cert isn’t an outage yet.
Add an HTTP monitor
- Go to Monitors → New monitor.
- Enter the URL to check and the method.
- Set what counts as healthy: expected status codes, an optional keyword, an optional response-time threshold.
- Attach it to a component (or let Sentivel create one).
A monitor’s target is fetched from our servers on every poll, so it must be a public http(s) address. Private, loopback, link-local, and cloud-metadata hosts are rejected, and redirects are re-checked per hop.
Flap thresholds
Two settings control how decisive Sentivel is:- Open after N consecutive failures. Higher means fewer false alarms, slower detection.
- Resolve after N consecutive successes.
Intervals, pausing, and maintenance
Set how often each monitor runs. Pause a monitor to stop checks without deleting it. Put a monitor (or a whole workspace) into a maintenance window to skip checks while you do planned work, so it doesn’t fire a false incident or dent uptime.Maintenance from the API
Drive maintenance from your own tooling, so your deploy can flip a server into maintenance and Sentivel follows. The monitor’s checks pause and its public component reads “under maintenance”.Open-ended (cleared when you're done)
until (ISO 8601) for a window that auto-expires.
Bounded window
DELETE. Checks resume on the next poll.
End it
sentivel_start_maintenance and sentivel_end_maintenance.
Response times
Every monitor records how long each check took, and breaks that time into the four parts of a request — so a slow monitor tells you what is slow, not just that it is.
The four add up to the total response time, so a spike in one band is the answer. DNS climbing while the rest holds steady points at your resolver, not your app; waiting climbing on its own points at the service itself.
The chart on a monitor’s page shows the split, with the numbers for any point on hover. Pick a window with the period selector, and filter to one probe region on a multi-region monitor.
The breakdown is on the Solo plan and above. Every plan measures and stores it, so moving up shows the history your workspace has already collected rather than starting from zero.
phases object on each bucket from GET /monitors/{id}/response-times, or sentivel_get_monitor_response_times over MCP. A band that wasn’t measured is null rather than 0.