> ## Documentation Index
> Fetch the complete documentation index at: https://docs.sentivel.com/llms.txt
> Use this file to discover all available pages before exploring further.
# Monitors
> Check that your services are up, and turn failures into incidents.
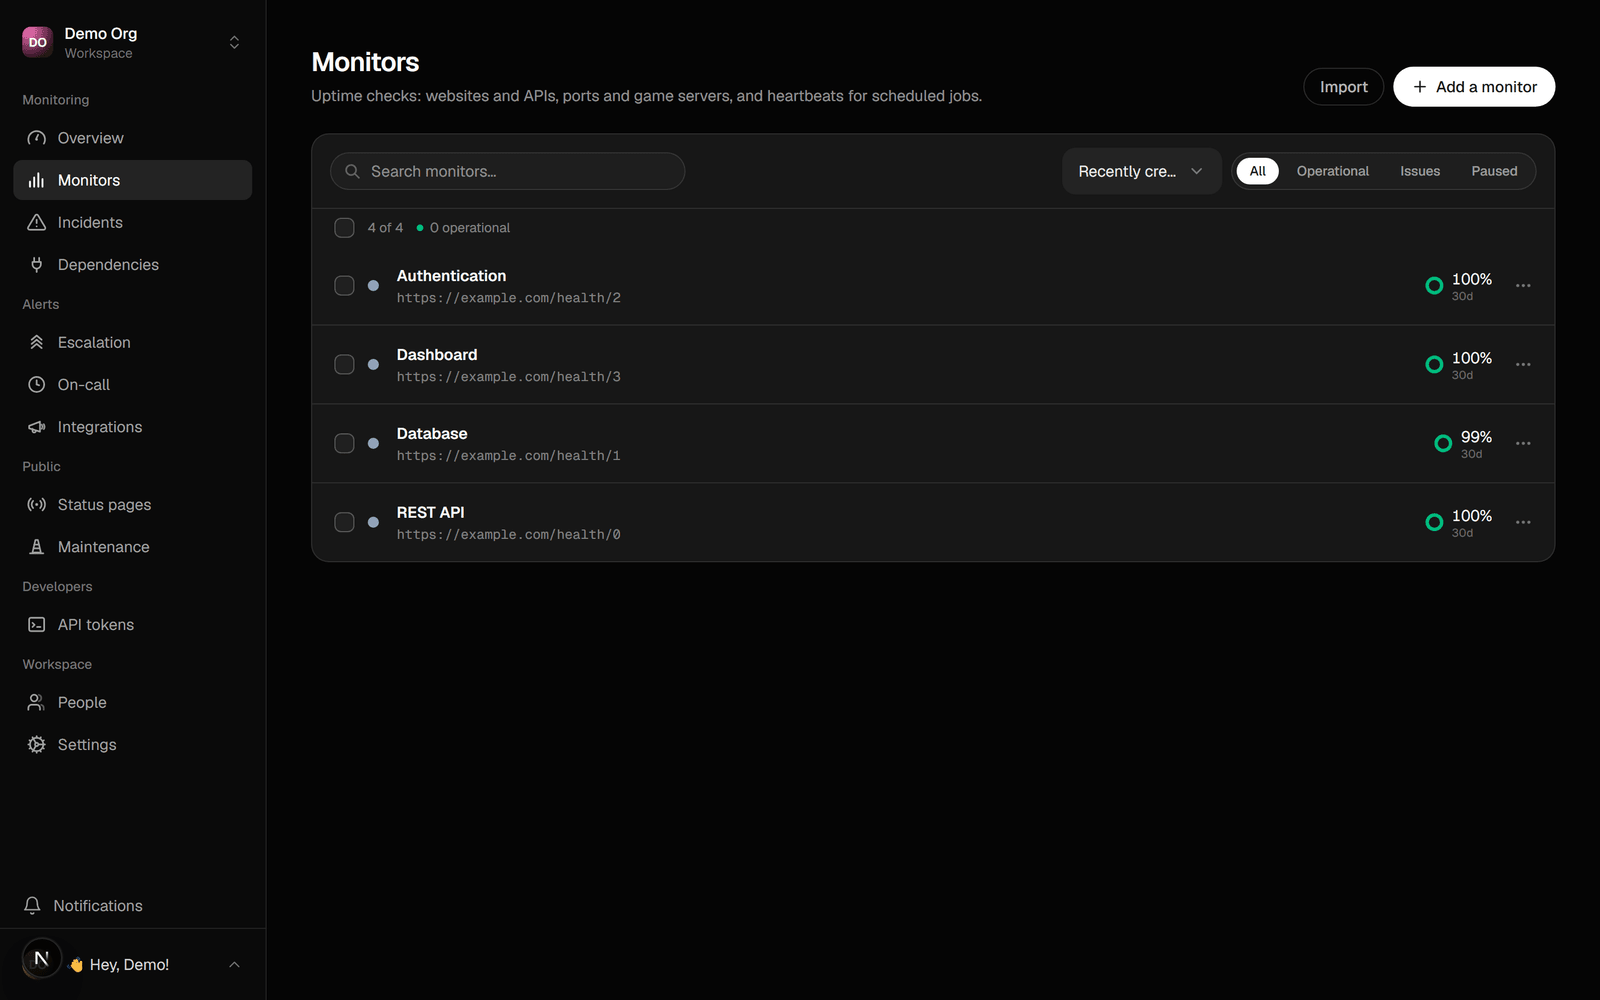 A monitor checks one thing on a schedule. When it fails enough times in a row,
Sentivel opens an incident on the component it's attached to and pages whoever's
on call. A single brief blip never opens an incident.
## Monitor types
* **HTTP.** Request a URL and assert on the response: expected status codes, a
keyword that must be present or absent, a response-time budget.
* **Heartbeat.** For cron jobs and workers. Your job pings a URL on a schedule;
a ping that's late by more than the grace period is a miss.
* **TCP.** Open a connection to a host and port (databases, mail, game servers).
* **DNS.** Resolve a record and assert on the answer, optionally through a
specific nameserver.
* **SSL.** Watch a certificate's expiry and warn before it lapses. This sends an
internal ops alert, not a public incident: a soon-to-expire cert isn't an
outage yet.
## Add an HTTP monitor
1. Go to **Monitors → New monitor**.
2. Enter the URL to check and the method.
3. Set what counts as healthy: expected status codes, an optional keyword, an
optional response-time threshold.
4. Attach it to a component (or let Sentivel create one).
The first check runs on the next poll cycle, within about two minutes. Until a new
monitor strings together its first run of healthy checks, its component reads
"warming up" rather than a premature green.
A monitor's target is fetched from our servers on every poll, so it must be a
public http(s) address. Private, loopback, link-local, and cloud-metadata hosts
are rejected, and redirects are re-checked per hop.
## Flap thresholds
Two settings control how decisive Sentivel is:
* **Open after** N consecutive failures. Higher means fewer false alarms, slower
detection.
* **Resolve after** N consecutive successes.
A recovery that doesn't meet the resolve threshold stays the same incident. A
confirmed resolution followed by a fresh run of failures is a new one.
## Intervals, pausing, and maintenance
Set how often each monitor runs. Pause a monitor to stop checks without deleting
it. Put a monitor (or a whole workspace) into a maintenance window to skip checks
while you do planned work, so it doesn't fire a false incident or dent uptime.
### Maintenance from the API
Drive maintenance from your own tooling, so your deploy can flip a server into
maintenance and Sentivel follows. The monitor's checks pause and its public
component reads "under maintenance".
```bash Open-ended (cleared when you're done) theme={null}
curl -X POST https://www.sentivel.com/api/v1/monitors/$ID/maintenance \
-H "Authorization: Bearer $SENTIVEL_TOKEN"
```
Send an empty body for open-ended maintenance when you don't know how long the
work runs. Pass `until` (ISO 8601) for a window that auto-expires.
```bash Bounded window theme={null}
curl -X POST https://www.sentivel.com/api/v1/monitors/$ID/maintenance \
-H "Authorization: Bearer $SENTIVEL_TOKEN" -H "Content-Type: application/json" \
-d '{ "until": "2026-07-06T02:00:00Z" }'
```
End maintenance with `DELETE`. Checks resume on the next poll.
```bash End it theme={null}
curl -X DELETE https://www.sentivel.com/api/v1/monitors/$ID/maintenance \
-H "Authorization: Bearer $SENTIVEL_TOKEN"
```
Over MCP, the same is `sentivel_start_maintenance` and `sentivel_end_maintenance`.
## Uptime
Sentivel keeps a daily uptime rollup per monitor, so the 90-day history on your
status page survives even as raw check data ages out.
A monitor checks one thing on a schedule. When it fails enough times in a row,
Sentivel opens an incident on the component it's attached to and pages whoever's
on call. A single brief blip never opens an incident.
## Monitor types
* **HTTP.** Request a URL and assert on the response: expected status codes, a
keyword that must be present or absent, a response-time budget.
* **Heartbeat.** For cron jobs and workers. Your job pings a URL on a schedule;
a ping that's late by more than the grace period is a miss.
* **TCP.** Open a connection to a host and port (databases, mail, game servers).
* **DNS.** Resolve a record and assert on the answer, optionally through a
specific nameserver.
* **SSL.** Watch a certificate's expiry and warn before it lapses. This sends an
internal ops alert, not a public incident: a soon-to-expire cert isn't an
outage yet.
## Add an HTTP monitor
1. Go to **Monitors → New monitor**.
2. Enter the URL to check and the method.
3. Set what counts as healthy: expected status codes, an optional keyword, an
optional response-time threshold.
4. Attach it to a component (or let Sentivel create one).
The first check runs on the next poll cycle, within about two minutes. Until a new
monitor strings together its first run of healthy checks, its component reads
"warming up" rather than a premature green.
A monitor's target is fetched from our servers on every poll, so it must be a
public http(s) address. Private, loopback, link-local, and cloud-metadata hosts
are rejected, and redirects are re-checked per hop.
## Flap thresholds
Two settings control how decisive Sentivel is:
* **Open after** N consecutive failures. Higher means fewer false alarms, slower
detection.
* **Resolve after** N consecutive successes.
A recovery that doesn't meet the resolve threshold stays the same incident. A
confirmed resolution followed by a fresh run of failures is a new one.
## Intervals, pausing, and maintenance
Set how often each monitor runs. Pause a monitor to stop checks without deleting
it. Put a monitor (or a whole workspace) into a maintenance window to skip checks
while you do planned work, so it doesn't fire a false incident or dent uptime.
### Maintenance from the API
Drive maintenance from your own tooling, so your deploy can flip a server into
maintenance and Sentivel follows. The monitor's checks pause and its public
component reads "under maintenance".
```bash Open-ended (cleared when you're done) theme={null}
curl -X POST https://www.sentivel.com/api/v1/monitors/$ID/maintenance \
-H "Authorization: Bearer $SENTIVEL_TOKEN"
```
Send an empty body for open-ended maintenance when you don't know how long the
work runs. Pass `until` (ISO 8601) for a window that auto-expires.
```bash Bounded window theme={null}
curl -X POST https://www.sentivel.com/api/v1/monitors/$ID/maintenance \
-H "Authorization: Bearer $SENTIVEL_TOKEN" -H "Content-Type: application/json" \
-d '{ "until": "2026-07-06T02:00:00Z" }'
```
End maintenance with `DELETE`. Checks resume on the next poll.
```bash End it theme={null}
curl -X DELETE https://www.sentivel.com/api/v1/monitors/$ID/maintenance \
-H "Authorization: Bearer $SENTIVEL_TOKEN"
```
Over MCP, the same is `sentivel_start_maintenance` and `sentivel_end_maintenance`.
## Uptime
Sentivel keeps a daily uptime rollup per monitor, so the 90-day history on your
status page survives even as raw check data ages out.